Hey! Oh! Let’s go! and old beloved song said… and here we go!
The H2020 FREEWAT Consortium, after two years of activities in the field of water management, has entered the most exciting part of its ambitious scopes.
We are pleased to announce the free release of the open source FREEWAT platform v.0.4 through the FREEWAT web site, at
http://www.freewat.eu/download-information (registration is needed for statistical purposes).
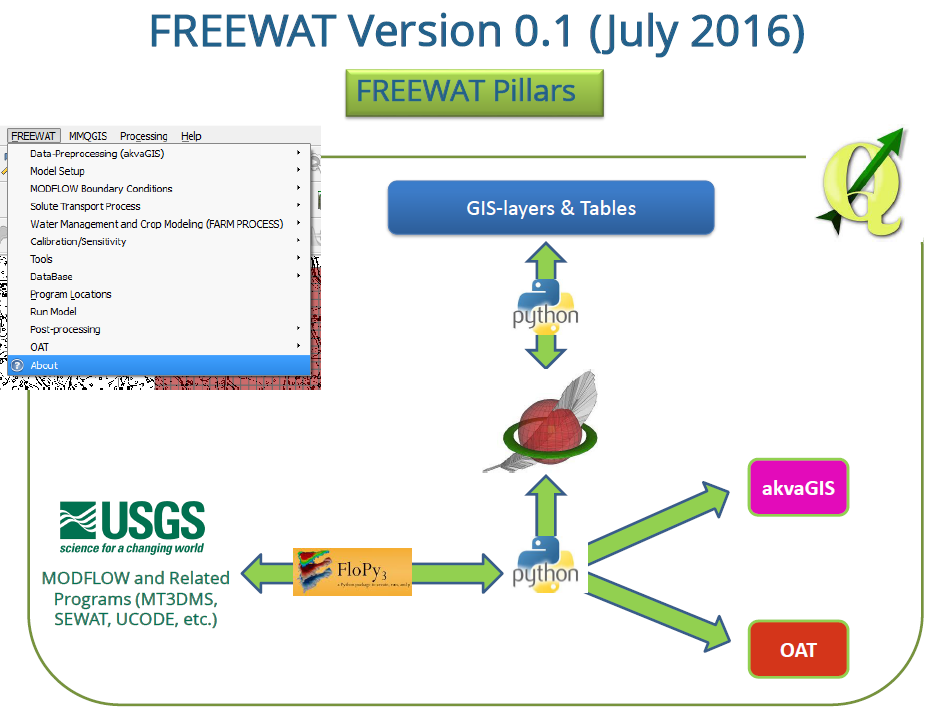
Starting from version 0.4, FREEWAT may be deployed for public usage, teaching and testing. FREEWAT is conceived as a composite plugin for the well-known GIS open source desktop software QGIS (http://qgis.org) and it is designed as a modular ensemble of different tools. Some of them can be used independently, while some modules require the preliminary execution of other tools. Capabilities integrated in FREEWAT are: i) simulation of the hydrological cycle (including surface-/ground-water interaction and infiltration through the unsaturated zone), by means of the codes MODFLOW-2005 and MODFLOW-OWHM; ii) simulation of solute transport in the unsaturated/saturated zone, including density and viscosity dependent flow, applying codes MT3DMS, SEAWAT and part of the brand-new MT3D-USGS; iii) a module for water resource management and optimization of conjunctive use, including issues related to irrigation management, exploiting capabilities of MODFLOW-OWHM; iv) specific tools for the analysis, interpretation and visualization of hydrogeological and hydrochemical data and quality issues (akvaGIS module); v) a tool for time-series processing to support connection with server-side sensors, input data processing and advanced model calibration (OAT module); vi) a module for calibration, sensitivity analysis and parameter estimation based on UCODE_2014.
H2020 FREEWAT architecture.
By entering the download area, you will be able to download:
- the FREEWAT plugin;
- the FREEWAT User Manuals;
- program executables of the integrated modules;
- a large set of tutorials with related datasets for practicing with FREEWAT.
A large number of training courses is organized up to July 2017. Please visit the webpage: http://www.freewat.eu/freewat-courses for the complete list of courses.
Should you be interested in organizing a FREEWAT course at your institution, please contact us.
Rudy Rossetto
The Consortium
The project Consortium is made up of 19 partners representing various water sectors from 11 EU countries, Switzerland, Turkey and Ukraine and UNESCO international organization.
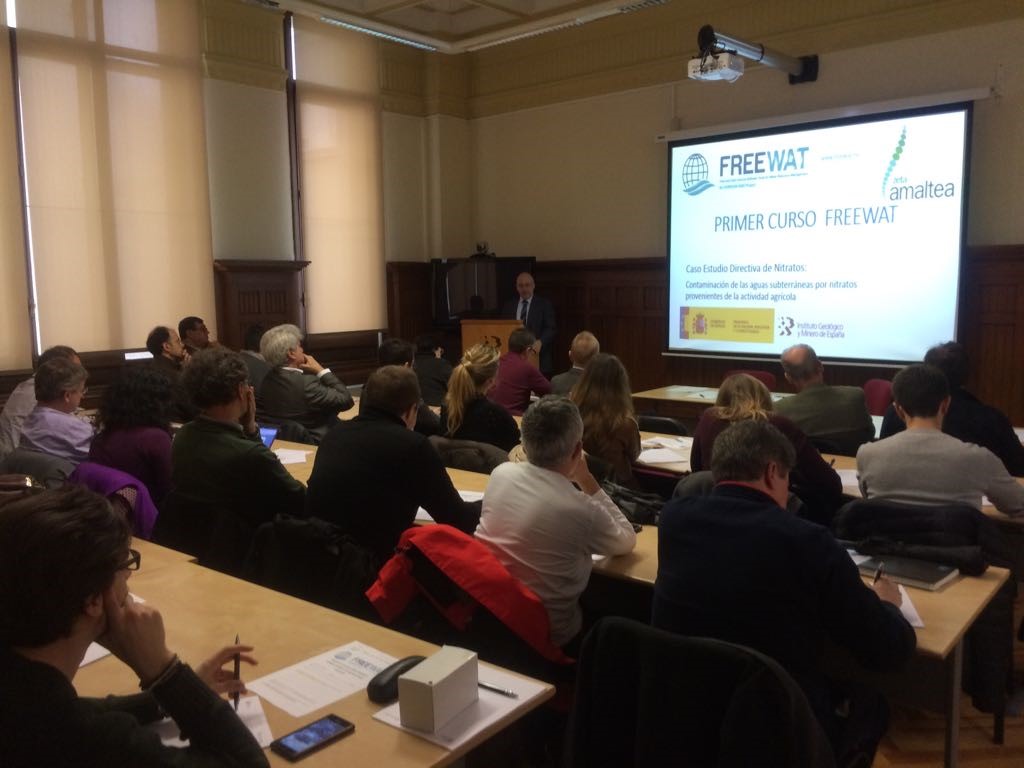
CAPACITY BUILDING COURSES AT NATIONAL LEVEL
FREEWAT courses at national level are currently organised and conducted throughout the project area; more than 40 courses is expected to be eventually held within the EU, its neighbouring countries Ukraine and Turkey and in Africa (South Africa, Namibia and Botswana). Each course is followed by an evaluation of the tools by participants, ensuring that the courses have achieved their targets, namely: to share the FREEWAT Consortium knowledge and to provide easier access to essential tools such as groundwater modeling (flow and transport), analysis of hydrochemical data, time-series analysis, simulation of water management on rural areas, among others.
To date, more than 250 professionals have attended one of 13 local courses held in several countries, including Estonia, Germany, Latvia, Spain, South Africa, Turkey or Ukraine. The course participants are now qualified to independently use the platform in solving their water quality and quantity problems.
Until the end of May, 26 local courses are scheduled in several project countries, including Romania, Germany, Czech Republic but also, USA or Austria (upcoming short course during the EGU 2017 Congress), among others.
A new release of the FREEWAT platform is going to be out (version 0.4) and freely downloadable from the FREEWAT web site by the first week of April. The FREEWAT platform is showing increased potential of providing solutions to environmental water assessments, ensuring the compliance with standard regulatory guidelines.
For more information about the courses schedule and how to attend to these courses, which are generally free, visit: http://www.freewat.eu/freewat-courses
Road to QGIS 3
In the last years, more Developers and Users are joining the QGIS Community. QGIS has became the standard open source GIS for public authorities, universities, research institutes, but also and especially for private companies.
QGIS is a reliable, quick and very complete GIS analysis software for all the kind of Users.
In late September 2013, the version 2.0 was released and then, a new stable version with bug fixing and feature improvements have been available to the Users every 4 month. Moreover, Long Term Releases (LTR) have been released and their maintenance has been guaranteed for about one year (until the next stable version was mature to become LTR).
At the moment, the latest stable release is 2.18 Las Palmas and the LTR release is 2.14 Essen. These will be the last 2 versions available: the QGIS community decided to move forward and begun to develop the 3 release.
This decision was made consciousness: other software which QGIS relies on (Python, Qt) are developing new versions and the old ones will not be longer maintained. For that reason, the community is developing QGIS with Python 3 and Qt 5 support. The first 3 release is scheduled on September 2017, while the first 3 LTR release on January 2018.
What are the consequences for the Users? Once the first 3 version will be released, the support for the 2 versions will continue until the first 3 LTR release will be ready and the Users will be invited to move to QGIS3.
One of the big consequences of this migration are plugins: all the plugins have to be adapted to Python 3, Qt 5 and the new QGIS 3 APIs.
QGIS 3 is already available as a development and unstable version: more and more people are refactoring the code and introducing new features. In fact, the development version is very stable and daily code contribution are added.
At the beginning, the User that will open QGIS 3 will not notice any big changes: QGIS is already well made and there are no reasons to change the interface.
However, under the hood, QGIS 3 has a brand new engine, where a lot of the old code has been rewritten making the software more reliable, quick and easy to develop.
Besides the code changes that the User will not be aware of, hundreds of new features have been introduced.
For example, QGIS 3 will have a native Task Manager that can be used to pause and reload long processes.
Another great feature is the Multi Map Support that allows to have more maps in the same session and at the same time:
Lots of new algorithms have been moved to the Processing framework, in order to include them in complex models and external Python scripts.
The printing layout system has been revised, it is quicker and more reliable even for large projects with many layers and complex symbols.
Many other improvements and enhancements have been made and several others are in progress and will be available for QGIS 3.
All the Users, Developers and people working with QGIS will find a comfortable, nice and clean framework to work with.
Matteo Ghetta (
Scuola Superiore Sant'Anna, Pisa)
Observation Analysis Tool (OAT)
OAT is a module specifically designed by SUPSI to process time-series data within FREEWAT. In fact, time-series are a key aspect in environmental modeling, and are getting more and more relevant with the increasing establishment of diffuse, online and real-time monitoring systems. The most diffuse usage of time-series data is related to the need of understanding the system to be modeled and to create, or support the creation, of input data. Another very important role of time-series is related to the calibration and validation of the models: in this case, time-series data are used to fit the model parameters, so that results match the observed quantities, and to evaluate how close the model simulations are to the reality. In groundwater modeling, time series are often used to define climate data (rainfall, evaporation, evapotranspiration), to set boundary conditions (water body stages or discharges), to indicate water management practices (irrigation and pumping rates) and also to define other components like contamination and transport.
OAT enables the FREEWAT User with the capacity to import, store, process, use and export time-series data. In particular, the module allows the management of both the spatial location and the corresponding measured values. This allows to access the map of sampled locations and to integrate data in the model, so that other FREEWAT modules can be used. Moreover, specific metadata, in line with the existing open standards, permits to understand unit of measurements, type of used sensors, observed property, etc. Dedicated panels have been implemented to add time-series from different data source types, to manage existing data, to process time series and to visually compare in time different properties. Supported input formats are comma separated values (CSV), manually entered values, istSOS web-based Sensor Observation Service (SOS) and MODFLOW listfile (model budget properties), hobfile (simulations of heads) and gagefile (simulated results for streams, lakes and the unsaturated zone). Processing interface permits to select among an extensive number of functions that include filling, interpolation, aggregation, integration, filtering, statistics calculation, difference, hydrograph separation, and much more. More information are available in this video: https://youtu.be/ygC0vztrRYA
Massimiliano Cannata (University of Applied Sciences and Arts of Southern Switzerland)
The Case Studies…
Pilot site Vrbanski plato, Slovenia
Geographical, morphological and geological settings
The pumping station of Vrbanski plato is the most important water source for 14 municipalites in northeast part of Slovenia and lies within the territory of Maribor, the second large city in Slovenia. Due to the HEPP dam Mariborski island and the dam in Melje, the aquifer is extremely abundant and independent of periods of drought and climate change. Its share in the public water supply system is approximately 70 %.
The high significance of the pumping station demands effective water resource management. Part of the management is a good hydrogeological information system, which is used as the basis of the controlled enrichment and active protection system of the water source Vrbanski plato. The area of the aquifer Vrbanski plato is protected by the National Decree on water protection zone of the water body of Ruše, Vrbanski plato, Limbuška Dobrava and Dravsko polje, which determines the water protection zones and water protection regime (Figure 2). The plane area on the left and right Drava riverbank between Maribor island and Melje is composed of gravel and sand quaternary alluvium. Deposition of gravel and sand followed an era of intense lifting, in which Drava cut its deep riverbed under the foothills of hills. The riverbed was 14 m deeper than today at Maribor island.
Hydrological and hydrogeological settings
Two types of stone are important for hydrogeology: permeable Pliocene gravel and sand and impermeable tertiary marl and sandy marl, sandy stone, diageneticly agglutinated clay, and conglomerate. The permeable sandy gravel composes the Pliocene terraces on the left and right riverbank. These layers have a changing percentage of scree, which decreases the permeability.
Based on geological research, the following hydraulic conductivity estimates exist:
at the center of Vrbanski plato and the city, the hydraulic conductivity ranges from 6*10-3 to 9*10-3 m/s. The hydraulic conductivity is lower close to the Drava riverbed and close to the old Drava banks, where it is estimated to be 5*10-3 m/s, somewhere even 1*10-3 m/s. In the Melje area, the hydraulic conductivity is somewhat lower. According to geologic estimates, close to the Drava bank it is approximately 2,4 to 4,5*10-3 m/s and in the interior approximately 1,7 to 3,8*10-3 m/s.
Conceptual model The groundwater flow runs along the old riverbed of Drava. The axis of the old riverbed runs from the point above the HEPP Mariborski island, and then turns under Limbuška dobrava towards Mariborski otok and the bridge on it. From there, it runs northeast through the pumping station of Vrbanski plato and continues towards southeast. At the Studenci bridge in the area of Lent, it re-intersects with the current riverbed, then runs parallel with it till the railway bridge, and then passes on the right bank of Drava.
Model results
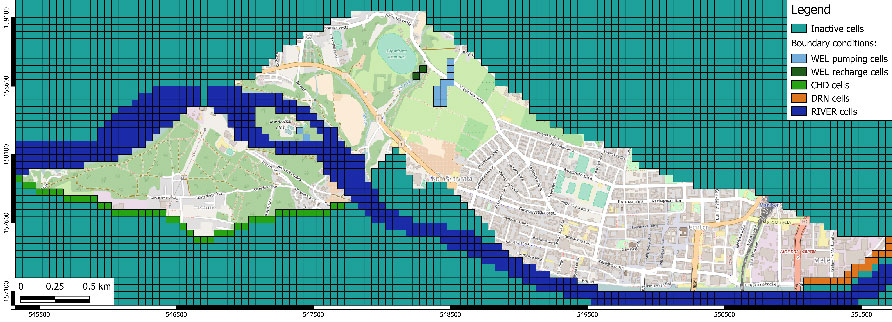
The first objective of our case study was to establish a stationary model of the aquifer Vrbanski plato, with calibration and validation done on average yearly pumping rates during the year 2015. For the need of the first part of the project, the model was constructed in a stationary phase, with the model area divided into 50 x 50 m grid cells, where the following boundary conditions were taken into account:
RECHARGE package - precipitation with two zones,
RIVER package – infiltration of river Drava,
CHD package – hinterland groundwater flow from Pohorje,
WEL package – 4 pumping wells located on Mariborski island, 14 wells on the pumping station Vrbanski plato and 2 recharge wells in the valley of Vinarski potok.
End Users
There are three main partners and beneficiary of this case study. The first is Slovenian Environment Agency, which has for water management groundwater models for all important aquifers in Slovenia, except Vrbanski plato. The second one is the Inter-municipalities Agency for environmental protection and nature conservation Maribor, which is a local authority with the task of protecting groundwater. They coordinate between the 14 involved municipalities and carry out additional emission monitoring for the protection of groundwater as water resource in this region. Not at least beneficiary of this case study is the regional waterworks company (Mariborski vodovod), which needs information to optimize the use of artificial groundwater recharging and actively protect the existing pumping station and how to plan next steps of managed groundwater recharging.
Pilot site Selisoo, Estonia
Selisoo bog is a wetland in north-eastern Estonia that belongs to Natura 200 network, whose aim is to assure the long-term survival of Europe’s most valuable and threatened species and habitats. The development beside the wetlands can significantly change their water regime. At the same time, wetlands are physically and ecologically adapted to small water table variations near the peat surface. The reduced regional groundwater level causes a water table decrease in the peat layer during dry periods, consequently influencing surface water storage and flow in the area, but also wetland plant communities. The wetland dependence on groundwater levels is most evident in cases when the recharge is reduced for a significant time interval. Selisoo bog is an area where the direct impact of underground mining activities on groundwater regime and therefore also on wetland water balance can be studied by groundwater modelling.
A 430 km2 area, where a wetland is located 3 km far from an underground oil-shale mine, was selected with the aim of assessing the effect of underground mining and its possible future extension to a neighbouring wetland. The main task is to calculate if the peat layers and the Quaternary sediments (Q) below the bog are sufficient to keep wetland from draining when underground mine, which operates at the depth of 55 to 60 m from the ground surface, reaches the borders of wetland protection area.
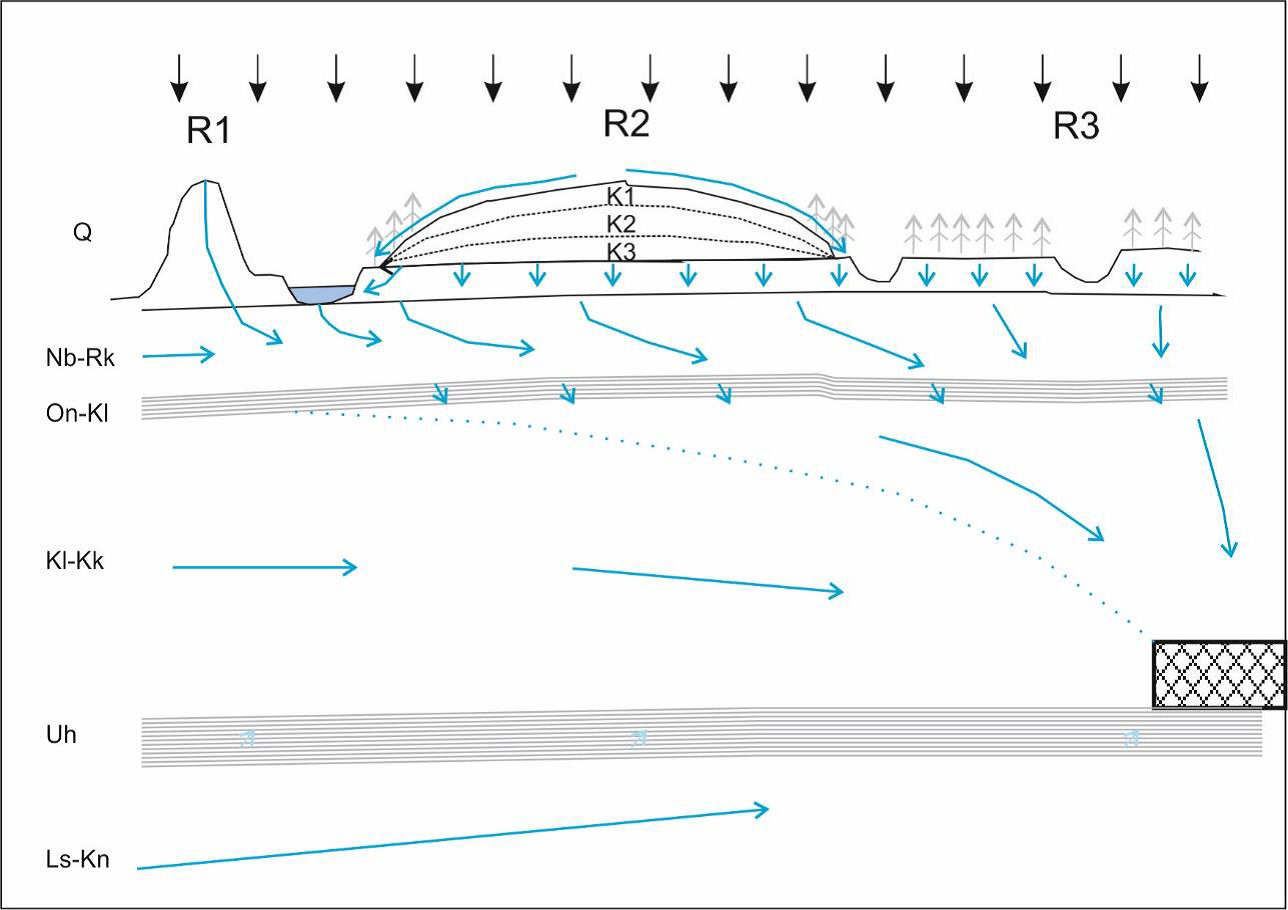
Bedrock topography of carbonaceous rocks of Ordovician age lies at an altitude from 70 to 20 m a.s.l. and is dipping towards the south and southeast. Thickness of Quaternary sediments covering the bedrock is about 5-10 m, reaching up to 15 m in Mäetaguse esker. The oil-shale layer, which is the target of mining, is located at the depth of 50-60 m and is about 2 m thick in study area. Oil-shale is a part of the Ordovician Aquifer System that consists of fissured limestones and dolomites with total thickness up to 100 m in Selisoo area. In general, the number of horizontal and vertical fractures and fissures and the size of openings decrease with depth in limestones and dolomites. Consequently, the lateral conductivity in the carbonate bedrock is vertically variable: 10 to 50 m/d in the topmost 20 m, 5 to 8 m/d at depth of 20 to 50 m, and only 1 to 2 m/d at depth of 50 to 100 m. The presence of clayey limestone and marl layers generates less conductive zones and therefore there are 3 different local aquifers (Nabala-Rakvere – O3NbRk, Keila-Kukruse – O3KlKk and Lasnamäe-Kunda – O2LsKn) and 2 aquitards (Oandu - O3OnKl and Uhaku – O2Uh). The first layer in the model (Quaternary) is vertically discretized into three sub layers to sufficiently simulate the bog sediments with rapidly decreasing hydraulic conductivities from top to bottom in contrast to the other quaternary deposits. The model area (27 x 16 km) was discretized square cells with 100 m side length.
The aim of the modelling is to assess the effect of mining to a wetland water balance. For future prognosis of this system, an accurate model basis is needed. Therefore, several alternative three dimensional steady-state numerical groundwater models should be developed, calibrated, evaluated and compared by means of statistical analysis to find the most accurate representation of the system as a basis for future transient simulations, in order to make predictions on the influence of mining activity on groundwater flow.
Pilot site Navarra, Spain
The EU Nitrates Directive (91/676 / EEC) aims at preventing nitrates from agricultural sources polluting ground and surface waters and at promoting the use of good farming practices. All the EU member states are committed to meet the Nitrates Directive, as one of the key instruments to protect European waters against agricultural pressures.
The Nitrates Directive (ND) forces member states to develop action programmes, aimed at preventing, monitoring, minimizing and ameliorating the nitrates pollution in water. The member states have to review the Nitrate Vulnerable Zones (NVZs) designation and the effectiveness of their action programs every 4 years, reporting to the EU Commission.
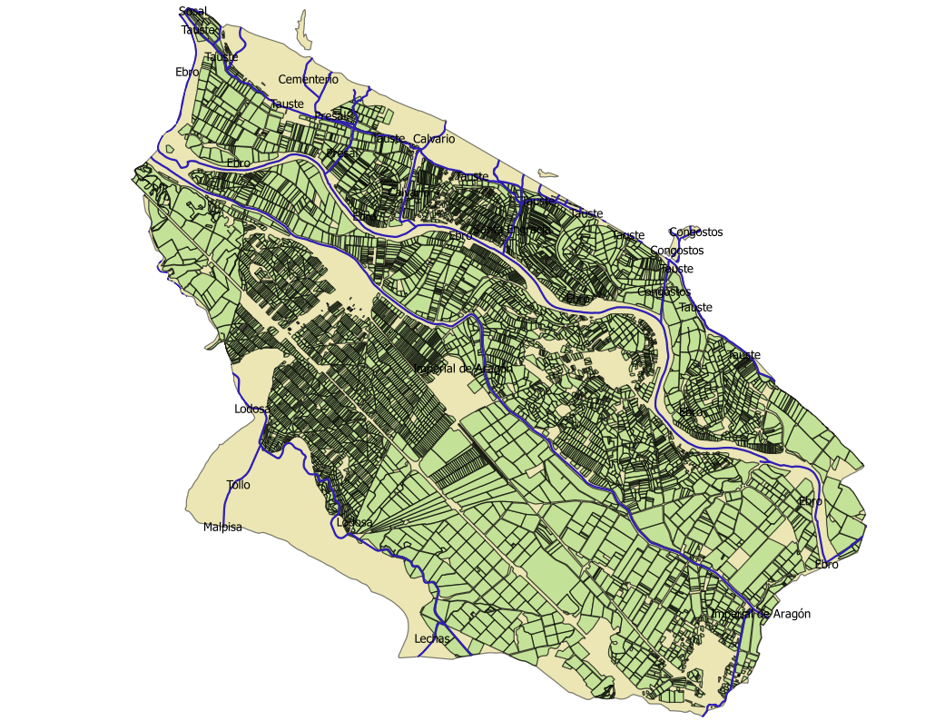
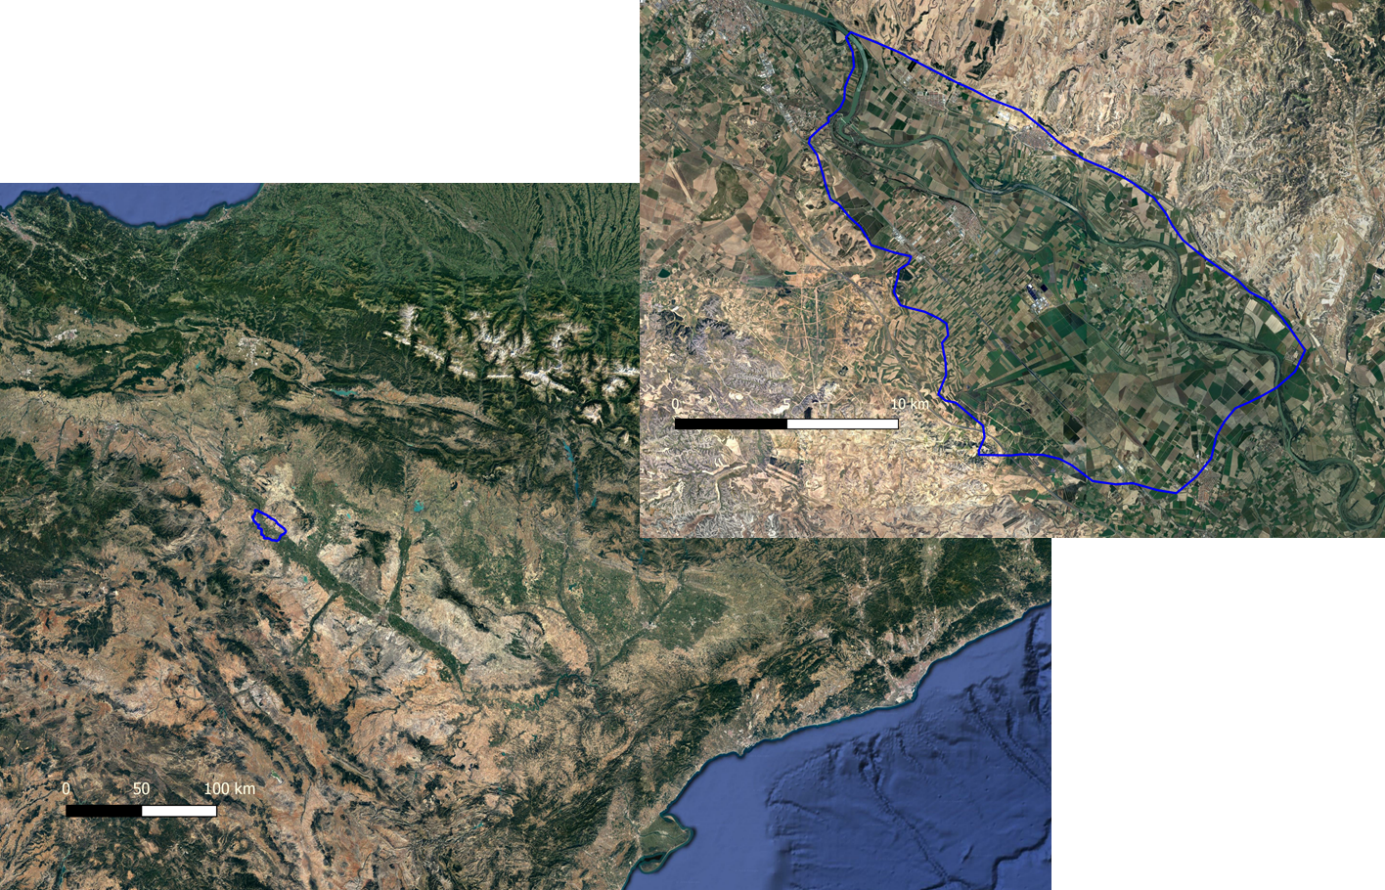
ND implementation is a duty of Spanish Autonomic Communities rather than a central government. Following the Nitrates Directive (ND) requirements, several zones have been declared as NVZ by the Government of Navarra in the Navarra’s section of the river. The action programs related to Nitrates Directive have been updated as well. Orden Foral 501/2013 points out the last ND Action Program in Navarra. The Amaltea’s case study in FREEWAT analyzes the problem of nitrate contamination in the NVZ of Tudela-Cortes, located in the Ebro alluvial aquifer, in the middle section of this river. It has an area of about 13000 ha.
This area supports important agricultural activities, especially irrigation. The Tudela-Cortes NVZ has a high density of parceling (average size of plot of 1 ha).
Nitrate pollution due to current water and fertilizer management from each of the farms, considering CAP information is being simulated with FREEWAT.
A pre-processing stage allowed to simulate daily water infiltration and nitrate leach with the model SWAP. This information has been introduced in QGIS-MODFLOW using FREEWAT. The conceptual model was developed and stationary simulations and calibrations were made. The ultimate goal, however, is to evaluate the reliability of action program measures and to provide a tool to Water Administrations, which is able to help them in the design of such measures and in the implementation of ND.
Amaltea has informed Spanish stakeholders about the new possibilities open with FREEWAT. The Spanish Focal Group is actively involved in the project, providing several suggestions and recommendations to make the results useful in practice. Furthermore, the Navarra case study has been used in FREEWAT courses, attended by more than 70 people from the main Spanish institutions dealing with implementing Nitrates Directive. Spanish stakeholders are really interested, but according to their comments and suggestion there is much more to do before FREEWAT becomes a platform for regular use.
Amaltea bets and invests in FREEWAT, since it believes this is a quite complete tool, able to run MODFLOW from QGIS. We must, however, keep promoting and improving the tool, as well as enlarging its applications portfolio.
NEWS
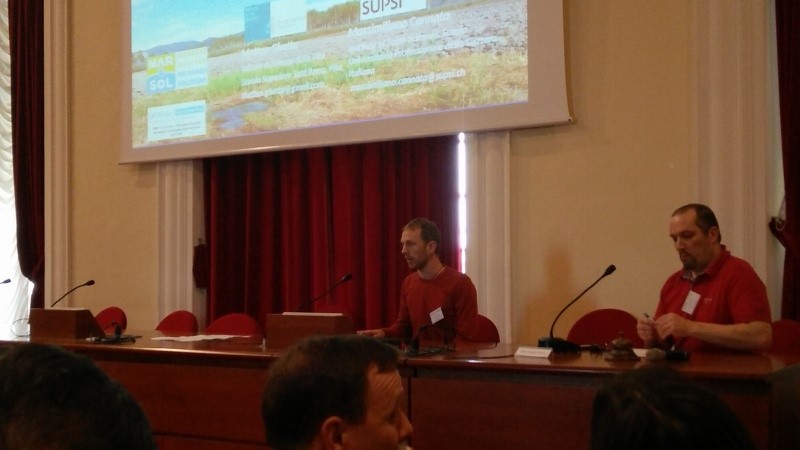
FREEWAT presented at the Italian FOSS4G conference in Genova, Italy
The FREEWAT project was presented by Matteo Ghetta (Scuola Superiore Sant'Anna, Italy) at the annual FOSS4G Conference in Genova, which is the most prestigious Italian conference about geographical free and open source software, aiming at showing the use of open source software in both public and private sector. The FREEWAT talk aimed at showing the capabilities of the FREEWAT platform, with a special focus on the QGIS integration of simulation codes and the public involvement of the stakeholders.
Link to the presentation and Conference website
MODFLOW, with the GIS-based GUI FREEWAT and Calibration and Uncertainty Quantification Using UCODE at Modflow and More 2017
The aforementioned course provides basic knowledge about MODFLOW, QGIS, building and running model applications using FREEWAT, data integration, and understanding of simulation dynamics using UCODE. By the end of the course, the Users will know how to:
• Develop MODFLOW models using QGIS and FREEWAT;
• Check problem set-up;
• Analyse model fit to data;
• Identify parameters that can and cannot be estimated given the available data;
• Estimate parameter values; and much more, including:
a) identify existing and potential new observations important to predictions and forecasts;
b) quantify uncertainty using a range of methods from those that are very fast (10s of models runs) and provide approximate values to computationally intensive methods such as MCMC (10,000s of model runs) that are less approximate;
c) engage skeptical stakeholders using alternative models;
d) account for alternative models in uncertainty evaluations. Strengths and weaknesses are discussed for all procedures and statistics.
Further information available at the conference website.
Brief practical workshop on FREEWAT at the Ukrainian GIS-Forum
The GIS-Forum is one of the most relevant geospatial conferences in Ukraine, which attracts representatives from enterprise, research, and education. During last year’s event, FREEWAT was presented in the form of oral presentation. Given the success of the previous conference, this year at the GIS-Forum held in Kharkiv, Ukraine on February 22nd – 24th 2017, the Ukrainian FREEWAT partner was invited to organise a one-hour practical workshop on the main FREEWAT services.
The workshop was based on training data from the Tutorial 0 and briefly discussed the topics as follows:
• approaches to the representation of the real-world conditions of the study area through numerical groundwater model;
• development of water-management scenarios and better understanding of water balance of the study area;
• analysis and visualization of the simulation results.
Below some links to the available materials:
The workshop program and its description http://gis-forum.org.ua/files/2017/master-class.pdf
A workshop screen cast (produced and published 01/03/2017) https://www.youtube.com/watch?v=kfDG8t0LO30&index=7&list=PLD6Zjzv3jx6-B_sFnbPhf5vgX2w-xoRLW&t=3s
Waterwise 2017 Flash Report
The annual Waterwise conference held in London on 8 March 2017 was an exceptionally stimulating event with 19 ICT4Water cluster projects funded by EU that shared experiences and presented results on ICT applied to water to enhance networking, communication, dissemination, policy, research and market opportunities returns. To read the full article please visit the FREEWAT website http://www.freewat.eu/news/waterwise-2017-flash-report
UPCOMING RELATED EVENTS
IAHS 2017 congress in Port Elizabeth, South Africa
The will be held in Port Elizabeth, South Africa, on July 10th-14th 2017.
The main topic is "Water and Development: scientific challenges in addressing societal issues”, which is particularly appropriate in the context of an IAHS Scientific Assembly meeting being held for the first time in sub-Saharan Africa and is well aligned with the IAHS Panta Rhei. Further information at http://cwrr.ukzn.ac.za/iahs/call-for-papers/iahs-2017-in-south-africa---invitation
4th EIP Water conference
This event will be held in Porto, Portugal, on September 25th 2017.
This annual conference brings together policy makers, national and local government, operators, scientists, researchers, technology companies, financiers, start-ups, SMEs, utilities, city planners, industrial producers, journalists and EU institutions at the European, national and regional level to break down the barriers to innovation in the water sector. Further information at http://www.eip-water.eu/porto-wins-competition-host-major-eu-water-innovation-conference-september-2017
 that the courses have achieved their targets, namely: to share the FREEWAT Consortium knowledge and to provide easier access to essential tools such as groundwater modeling (flow and transport), analysis of hydrochemical data, time-series analysis, simulation of water management on rural areas, among others.
To date, more than 250 professionals have attended one of 13 local courses held in several countries, including Estonia, Germany, Latvia, Spain, South Africa, Turkey or Ukraine. The course participants are now qualified to independently use the platform in solving their water quality and quantity problems.
Until the end of May, 26 local courses are scheduled in several project countries, including Romania, Germany, Czech Republic but also, USA or Austria (upcoming short course during the EGU 2017 Congress), among others.
A new release of the FREEWAT platform is going to be out (version 0.4) and freely downloadable from the FREEWAT web site by the first week of April. The FREEWAT platform is showing increased potential of providing solutions to environmental water assessments, ensuring the compliance with standard regulatory guidelines.
For more information about the courses schedule and how to attend to these courses, which are generally free, visit:
that the courses have achieved their targets, namely: to share the FREEWAT Consortium knowledge and to provide easier access to essential tools such as groundwater modeling (flow and transport), analysis of hydrochemical data, time-series analysis, simulation of water management on rural areas, among others.
To date, more than 250 professionals have attended one of 13 local courses held in several countries, including Estonia, Germany, Latvia, Spain, South Africa, Turkey or Ukraine. The course participants are now qualified to independently use the platform in solving their water quality and quantity problems.
Until the end of May, 26 local courses are scheduled in several project countries, including Romania, Germany, Czech Republic but also, USA or Austria (upcoming short course during the EGU 2017 Congress), among others.
A new release of the FREEWAT platform is going to be out (version 0.4) and freely downloadable from the FREEWAT web site by the first week of April. The FREEWAT platform is showing increased potential of providing solutions to environmental water assessments, ensuring the compliance with standard regulatory guidelines.
For more information about the courses schedule and how to attend to these courses, which are generally free, visit: 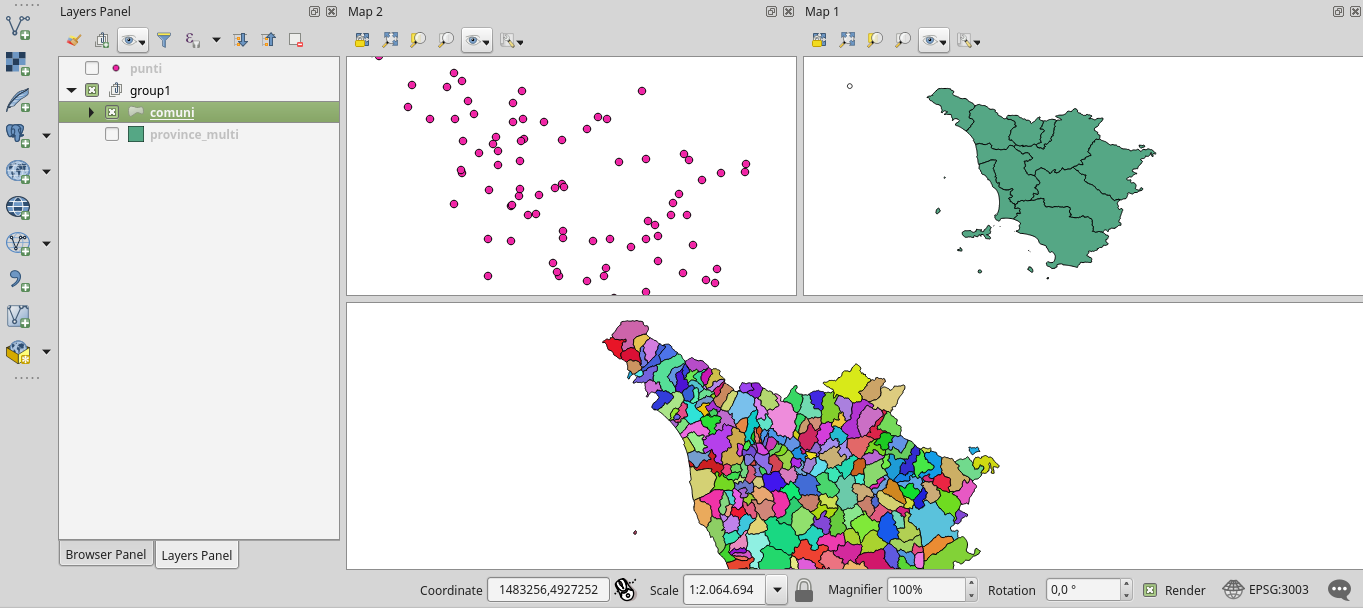
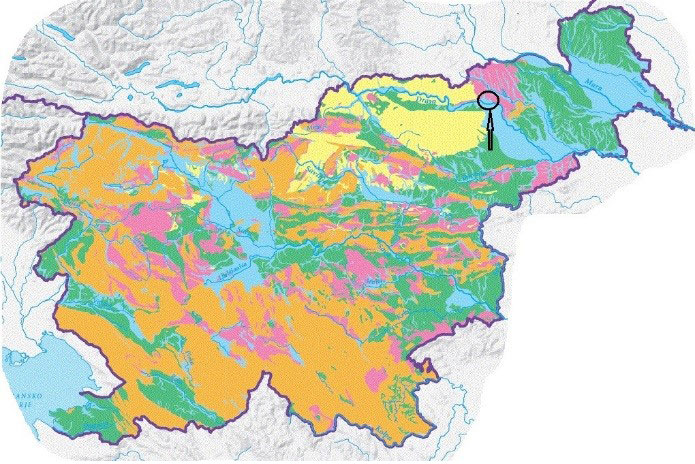 The high significance of the pumping station demands effective water resource management. Part of the management is a good hydrogeological information system, which is used as the basis of the controlled enrichment and active protection system of the water source Vrbanski plato. The area of the aquifer Vrbanski plato is protected by the National Decree on water protection zone of the water body of Ruše, Vrbanski plato, Limbuška Dobrava and Dravsko polje, which determines the water protection zones and water protection regime (Figure 2).
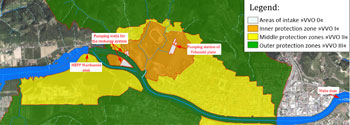 The plane area on the left and right Drava riverbank between Maribor island and Melje is composed of gravel and sand quaternary alluvium. Deposition of gravel and sand followed an era of intense lifting, in which Drava cut its deep riverbed under the foothills of hills. The riverbed was 14 m deeper than today at Maribor island.
 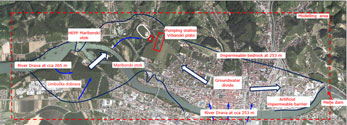 The groundwater flow runs along the old riverbed of Drava. The axis of the old riverbed runs from the point above the HEPP Mariborski island, and then turns under Limbuška dobrava towards Mariborski otok and the bridge on it. From there, it runs northeast through the pumping station of Vrbanski plato and continues towards southeast. At the Studenci bridge in the area of Lent, it re-intersects with the current riverbed, then runs parallel with it till the railway bridge, and then passes on the right bank of Drava.
 RECHARGE package - precipitation with two zones,
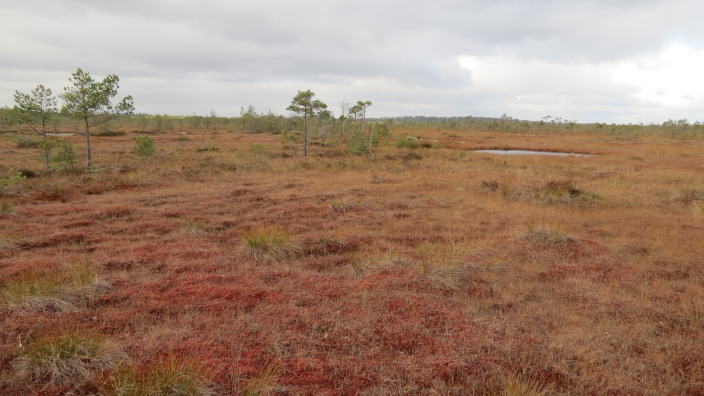
 This area supports important agricultural activities, especially irrigation. The Tudela-Cortes NVZ has a high density of parceling (average size of plot of 1 ha).
Nitrate pollution due to current water and fertilizer management from each of the farms, considering CAP information is being simulated with FREEWAT.
A pre-processing stage allowed to simulate daily water infiltration and nitrate leach with the model SWAP. This information has been introduced in QGIS-MODFLOW using FREEWAT. The conceptual model was developed and stationary simulations and calibrations were made. The ultimate goal, however, is to evaluate the reliability of action program measures and to provide a tool to Water Administrations, which is able to help them in the design of such measures and in the implementation of ND.
This area supports important agricultural activities, especially irrigation. The Tudela-Cortes NVZ has a high density of parceling (average size of plot of 1 ha).
Nitrate pollution due to current water and fertilizer management from each of the farms, considering CAP information is being simulated with FREEWAT.
A pre-processing stage allowed to simulate daily water infiltration and nitrate leach with the model SWAP. This information has been introduced in QGIS-MODFLOW using FREEWAT. The conceptual model was developed and stationary simulations and calibrations were made. The ultimate goal, however, is to evaluate the reliability of action program measures and to provide a tool to Water Administrations, which is able to help them in the design of such measures and in the implementation of ND.